Have you heard of NPS, or Net Promoter Score? It’s a satisfaction survey methodology created by Fred Reichheld, and it has become a trend in the events market.
That’s because measuring how loyal and satisfied your attendees are is a fundamental step in creating a successful event.
After all, you first need to understand who your attendee is and what they want before planning your next steps.
This way, a satisfaction survey can become one of the most effective strategies for gaining insight into your registrant’s journey, identifying areas for improvement and delivering a fitting experience.
Curious and want to know more? That’s exactly why we put together this complete article, where you’ll learn:
- What is NPS and how does it work?
- Why is NPS important for events?
- How to structure the survey correctly;
- And how to calculate NPS.
Let’s get started?
What is NPS?
NPS is the most widely used methodology in the world for measuring customer loyalty and satisfaction.
Because it’s very simple and objective, Net Promoter Score can be applied to any type of product or service, including your events.
It uses a single required question: “On a scale of 0 to 10, how likely are you to recommend our company (or event) to a friend or family member?”
This type of survey is very effective because it measures how likely customers are to recommend you.
How does NPS work?
Imagine this scenario: let’s say you went to a restaurant last weekend, and when you got there, you had a terrible experience.
Would you recommend that restaurant to your mom? Probably not, right?
That’s why NPS is so effective — it measures how likely a user is to recommend, or not recommend, the service or product they used.
So the Net Promoter Score question measures the likelihood of recommendation, and there’s no bigger indicator of customer satisfaction than recommending a company or service to someone you care about.
So when a customer answers an NPS survey positively, they’re signaling that they trust that company enough to recommend it.
Why is NPS important for events?
Now that you understand what NPS is, let’s talk a bit more about using this satisfaction survey at events.
Gathering feedback from your attendees is a fundamental step for identifying areas of improvement.
Through a satisfaction survey like NPS, you’ll gather information directly from the people who matter most for your event: your attendees.
And who better than them to evaluate the positive and negative aspects of each edition?
This way, this type of survey can help you understand in detail what your audience needs and, most importantly, what they want.
These insights will help you deliver a fitting experience for your attendees.
According to PwC data, when it comes to making a purchase decision, 89% of Brazilians point to customer experience as the most important factor.
How to structure the survey correctly?
NPS can include up to two questions when built out: one quantitative question and one qualitative question.
Let’s learn a bit about each of them.
Quantitative question
The quantitative question is the one we already know, and it’s required!
“On a scale of 0 to 10, how likely are you to recommend event X to a friend or family member?”
The quantitative question guides the respondent through a scale, making it easier for them to express their satisfaction as a number.
It’s the foundation of this satisfaction survey, which is why it’s required.
Users answer from 0 to 10, where 0 means “not at all likely” and 10 means “extremely likely.”
Qualitative question
The second question is what we call the feedback question, or qualitative question.
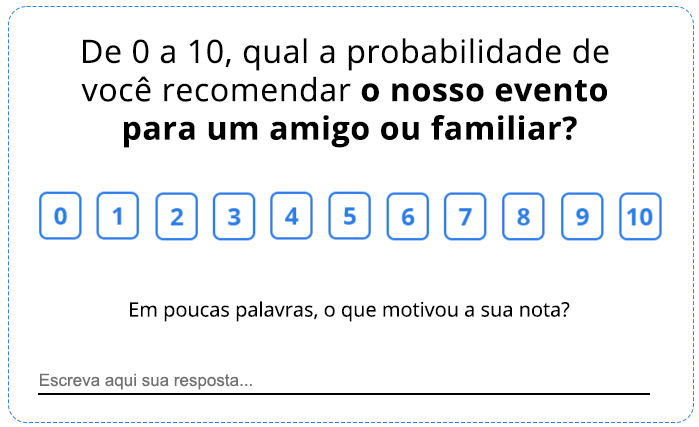
This one isn’t required — it’s simply a text field for the user to explain their answer.
Keep in mind that not every registrant will want to explain the reasoning behind their NPS score.
After all, many people aren’t inclined to answer open-ended questions. Text-based questions take more effort, since they require writing.
So making this question required can reduce the number of respondents to your survey. That’s why this practice isn’t recommended.
And how do you calculate NPS?
Now that you understand what NPS is, how to structure the survey correctly, and why this methodology matters for the events market, it’s time to learn how to calculate the Net Promoter Score.
Well, after answering the NPS survey, your attendees should be sorted into three groups.
Remember they answer the required question on a scale of 0 to 10? That scale is what we use to classify them as:
- Promoter attendees
- Neutral attendees
- Detractor attendees
Now let’s take a closer look at what each of these classifications means.
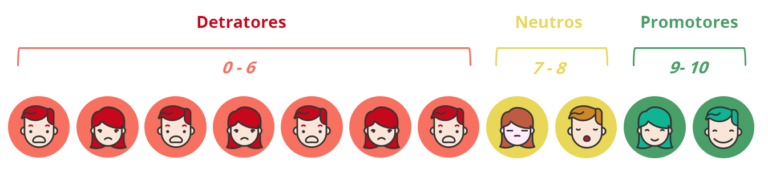
Promoters (Score 9 or 10)
Promoter attendees are those who gave a score of 9 or 10 in your event’s survey.
They can be considered loyal customers who are very satisfied with the experience they had.
These attendees love your event and defend it!
This way, they’re likely to recommend it to friends and family, or in the case of scientific events, to other researchers and members of the academic community.
Neutrals (Score 7 or 8)
Neutral attendees are customers who aren’t engaged with your event’s proposal or purpose. They rate it 7 or 8.
They had an indifferent experience, so it’s unlikely that they’ll come back for a future edition.
Neutral customers don’t recommend companies or services — they have no real loyalty and constantly look at competitors.
To help you understand, let’s say you run an annual academic event that accepts scientific paper submissions.
So if an attendee has an indifferent experience and becomes a neutral attendee, they might look for other options to submit their papers next year.
Detractors (Score 0 to 6)
Detractors are customers who rated your survey from 0 to 6 — in other words, they have a negative opinion about your event.
This type of attendee not only won’t return to events organized by you or your company, but also tends to spread the word about the service in a completely negative way.
Studies show that 75% of customers share an experience when it’s negative.
How to calculate your event’s net promoter score
Now that you understand how attendees are classified and which categories they fall into, let’s roll up our sleeves and get to work?
Calculating your event’s NPS index is very simple — just subtract the percentage of detractors from the percentage of promoters.
The formula looks like this:
%PROMOTERS – %DETRACTORS = NET PROMOTER SCORE
To understand the calculation and what “percentage” means here, let’s use the following example.
Let’s say you collected 100 responses at your event, and after classifying attendees you got:
- 70 promoter attendees
- 10 neutral attendees
- 20 detractor attendees
Calculating the percentage of each group, you get 70%, 10%, and 20%, respectively.
Now, to do the calculation, remember the formula is: %PROMOTERS – %DETRACTORS = NET PROMOTER SCORE
This way, exclude the neutrals from the equation and, to finish, subtract 20% (detractors) from 70% (promoters), which gives you a result of 50%.
Since Net Promoter Score results are always shown as a whole number rather than a percentage, in this example, your event’s NPS is 50.
But how do you know if that’s a good number? That’s exactly why the NPS classification zone was created.
NPS classification zone
The Net Promoter Score classification zone can range from -100 to 100 points, meaning:
- -100 to 0: Critical situation, full alert.
- 1 to 50: There’s a lot of room to improve at your event.
- 51 to 75: Your event has good quality — keep improving.
- 76 to 100: Your event is in the excellence zone, congratulations!
What counts as a good NPS?
There’s no exact answer to this question, simply because scores can vary between economic sectors, the type of product or service, and even the type of event yours falls into.
You can’t compare the NPS of an academic event to that of a music festival like Rock in Rio, for example. They’re completely different.
Any NPS result above zero means your event has more promoters than detractors.
Also, consider using NPS as a personal benchmark for your event, aiming to improve with each new edition.
The key to this methodology lies in the actions your event’s organization takes after the survey closes.
So identify areas for improvement, act on the feedback, and build a healthy relationship with your audience.
You can get started with Even3’s satisfaction survey example: