Imagine being able to answer questions like these in just a few clicks:
- Where do the people who register most for my event come from?
- Which Instagram post or email brought the most visitors to my page?
- At what point do visitors give up on registering?
All of this is possible with Google Analytics.
It works like an “invisible camera” on your event website. It records visitor actions and turns that data into clear information you can use to improve your strategies, sell more tickets, and make decisions with more confidence.
The best part? Even without technical knowledge, you can use Google Analytics for events. Let’s walk through it step by step. 👇
What is Google Analytics?
Google Analytics is a free tool from Google that collects and analyzes data about who visits your website and what they do there.
In the context of events, this means it can show, for example:
- How many people visited your event page
- How long they stayed on the site
- Which buttons they clicked
- Whether they started a registration or not
Basically, it works like a window into your attendees’ behavior, showing everything they did on your site.
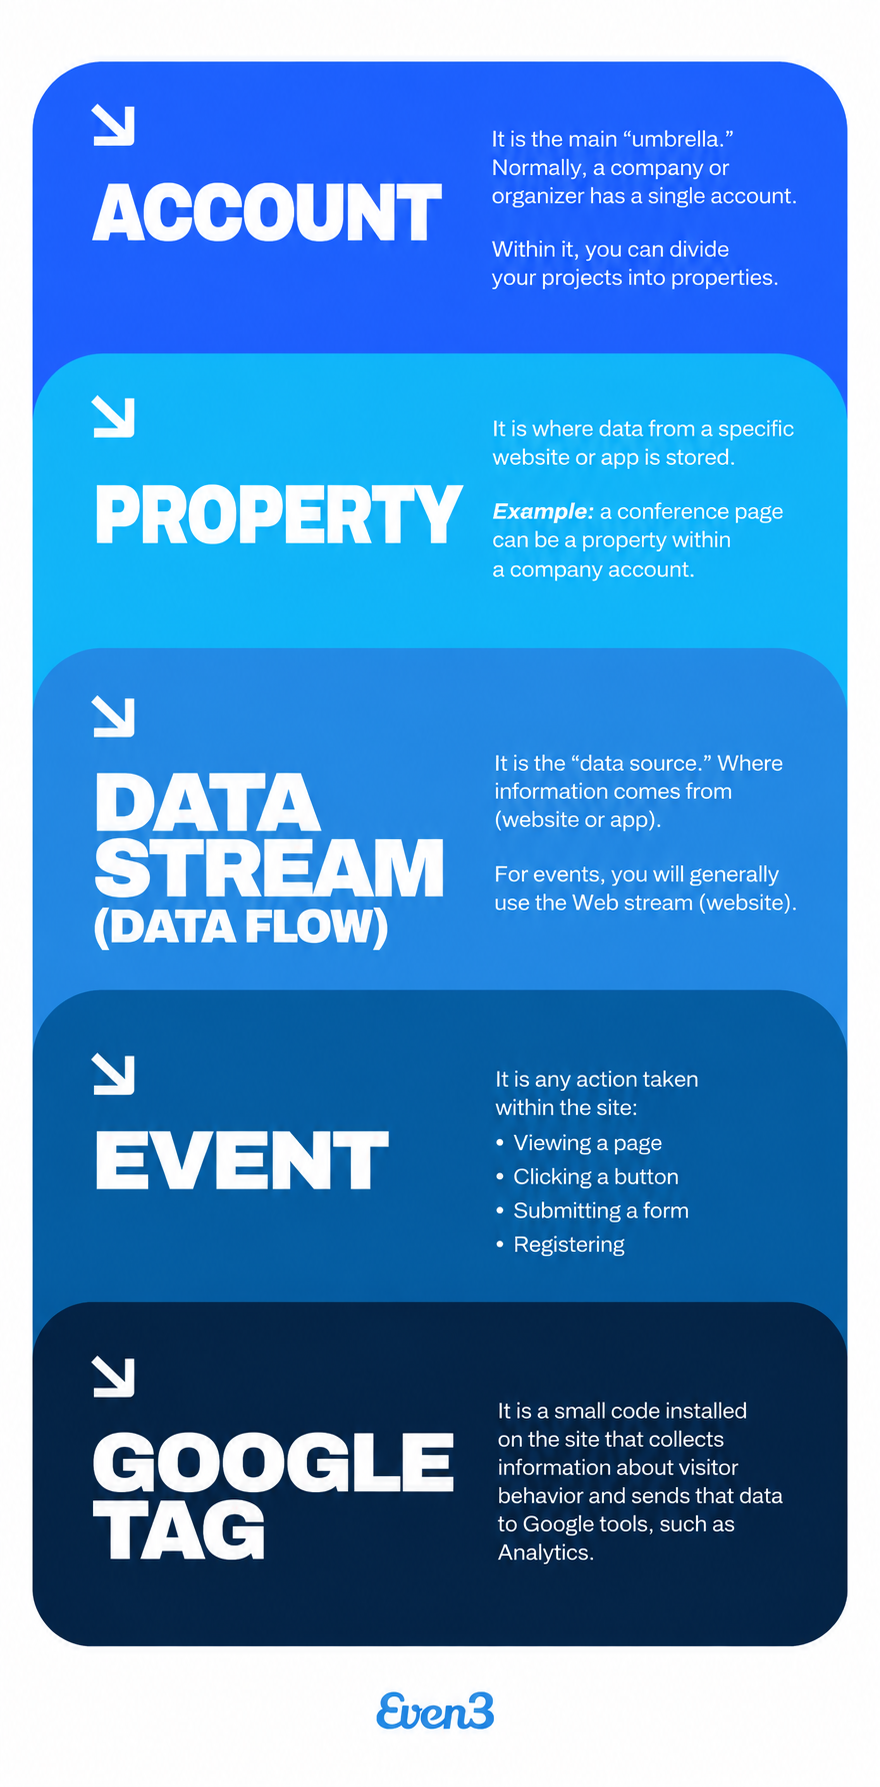
But this doesn’t happen automatically. To collect this data, Google uses a tag (a small piece of code) that is installed on your event website — including pages created inside Even3.
So to get started, you need to install it. Let’s show you how.
Google Analytics glossary: key terms to learn
First, let’s cover a few terms you’ll come across inside Google Analytics, so you can move on to the practical part more easily.
Dimension
The description of the data (in text format).
👉 Examples: page name, visitor’s city, device (mobile or computer).
Metric
The number related to the data.
👉 Examples: number of visitors, number of clicks, number of registrations.
Conversion (or Key Event)
An action that matters to you. For events, a conversion is usually:
- A registration
- A click on “Buy ticket”
- A click on “Talk to a consultant”
These actions can be marked as conversions in Google Analytics.
Now that the basics are clear, let’s get practical. 👇
What is Google Analytics used for in events?
Know where your attendees come from (Google Analytics + UTM / Google Ads)
You can find out whether people are reaching your event page through:
- Paid ads (Google Ads or social media)
To do this, it’s important to add a tracker to the links you use on Instagram, Google, and email.
This way, you’ll understand where it’s worth investing more in promotion.
See which pages of your event get the most visits (Google Analytics – Pages report)
With this report, you can find out:
- Which pages get the most visits
- Where people spend the most time
- Where they leave the site
This helps you improve the copy, images, and buttons on your most important pages to perform better and retain more attendees.
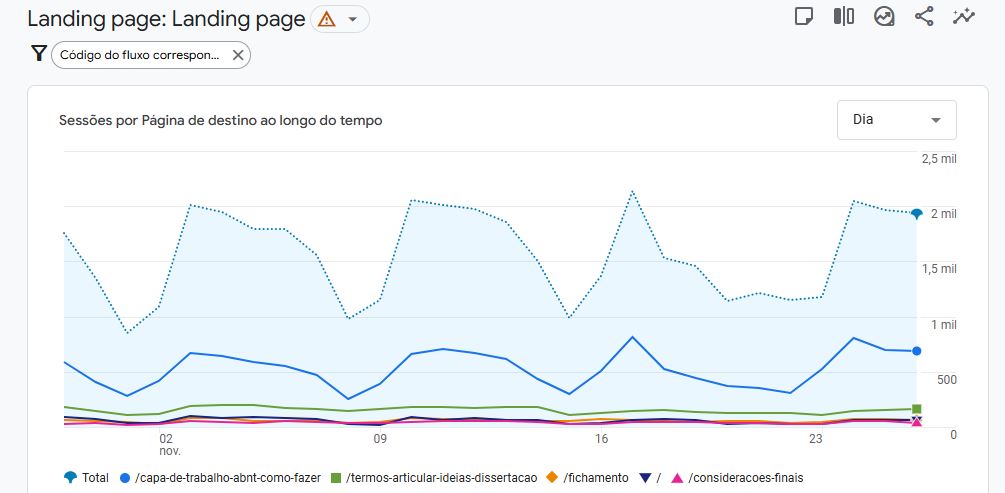
Landing Page report data in Google Analytics 4
Monitor button clicks (Google Tag + Google Analytics Events)
You can track clicks such as:
- “Register now”
- “Buy ticket”
- “View schedule”
- “Talk to a consultant”
This way, you understand whether people are actually interacting with the site or just visiting and leaving.
Track registrations as conversions (Events + Conversions)
If you mark event registration as a conversion, you’ll be able to see:
- How many people clicked to register
- Where they came from
- Which channel generates the most results
This is essential for scaling your next events.
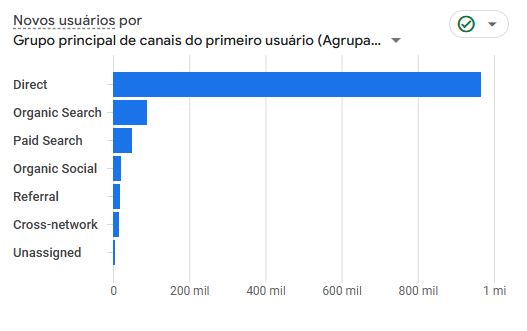
Channel data showing where users came from to reach the event site
How to use Google Analytics for events?
Now let’s put Google Analytics into practice on your event. You don’t need to be a developer or understand code. Just follow this path:
1. Create your Google Analytics account
Sign in to Google Analytics using your Google account (the same one you use for Gmail, for example).
Then click Create account and fill in:
- Account name: can be the name of your company or your events project
- Property name: usually the event or brand name
- Time zone: choose your country
- Currency: your local currency
Even3 Tip: If you organize several events, you can use one account for your brand and one property for each main event.
2. Create a Data Stream
Now you’ll tell Google Analytics where the data will come from. Choose the “Web” option.
Then add:
- Your event website URL (e.g., https://yourevent.com)
- Stream name (e.g., Website – Marketing Congress 2025)
At the end, Google will generate a tag (a tracking code). This tag is essential, as it’s responsible for sending your event site’s data to Google Analytics.
3. Enable “Enhanced Measurement”
Once your Data Stream is created, enable the Enhanced Measurement option.
It’s very important because it automatically collects information such as:
✅ Page views
✅ Scrolling
✅ Link clicks
✅ Site searches
✅ Downloads
In other words: with no extra effort, you already start understanding how people behave on your event page.
4. Install the Google code on your event site (the easy way)
Normally, this step would be technical. But with a good events platform, it becomes extremely easy.
If you use Even3, you can integrate Google Analytics in just a few clicks, directly from the event’s integrations menu, without touching any code.
This means:
- Google starts receiving data automatically
- You don’t need a developer’s help
- Everything stays connected: website + registrations + visits
✅ Simple, fast, and integrated into your event.
5. Check that Google Analytics is working
Once the tag is installed, go to:
Realtime reports
Open your own event site (in another tab) and check whether someone shows up as active in the report.
If it appears: you’re done! Google Analytics is now collecting data from your event.
⚠️ Important reminder: some more complete reports can take up to 24 hours to appear with all the data organized.
How to turn important actions into conversions?
Remember those conversions we mentioned? In Google Analytics, you can mark important actions as Conversions (Key Events).
For events, the best conversions are usually:
- Completed registration
- Click on “Buy ticket”
- Click on “Talk to a consultant”
- Newsletter sign-up
Then go to the left panel of Google Analytics and click:
Admin → Data Display → Events → Mark event as conversion
From there, you’ll clearly see:
- How many conversions your event generated
- Which channel brought in the most registrations
- Which campaign performed best
This is gold for improving the promotion of your next events.
Which reports should event organizers look at first?
If you’re still lost using Analytics, don’t worry! There really is a lot of data. But if you want to keep track of the basics, click on Reports in the side menu and follow:
📥 Acquisition
Shows where people come from: Instagram, Google, email, ads, partners.
Here you discover your strongest channels and see the data for those custom links you created. Remember?
💬 Engagement
Shows what people do inside your site: most viewed pages, time on site, most clicked buttons.
Here you understand your audience’s interest.
🎯 Conversions
Shows how many important goals were reached: registrations, sign-ups, strategic clicks.
Here you measure the real result of your event, provided you’ve set up conversions.
Best practices for organizing your data
Before wrapping up, a few golden tips:
- Always use the same account for your company
- Create a property for each important event
- Filter out internal traffic (like your own team) and limit permissions so you don’t clutter the data
- Think about data before your next event, not after — know in advance what you’ll want to collect
Remember: Google’s data can’t be changed after it’s collected. So getting it right from the start is essential.
Extra tip: track your data more easily
Finally, if you use Even3 to build your event website, manage registrations, and promote your event, you have a huge advantage: you can integrate Google Analytics into your event page in just a few clicks, straight from the platform, with no code and no hassle.
This way, you’ll be able to keep a close eye on your event site. Beyond the Google Analytics integration, the platform also offers a special feature for business organizers: Even3 Analytics.
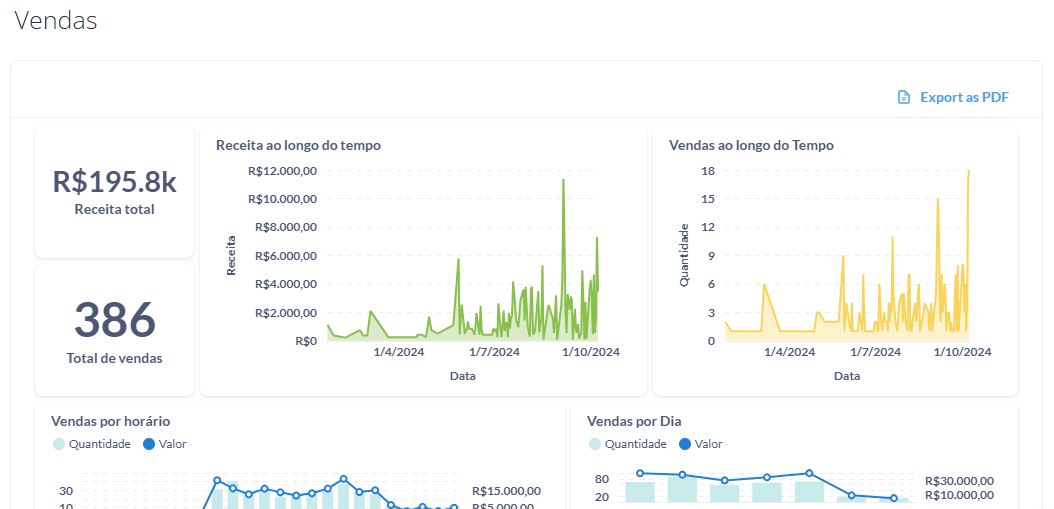
Even3 Analytics sales dashboard
After all, it’s genuinely a lot of work to run several events a year and still have to manage multiple platforms, isn’t it?
That’s why Even3 decided to bring the entire event data dashboard into the same platform where the event is organized. It’s as if Google Analytics were built right into Even3!
With it, your company gets access to complete reports on:
- Demographic data to better understand your audience;
- Information about your event website visitors that can help you build audiences for ad campaigns;
- Payment methods used at the event for financial reports;
- Days and times of peak sales to check marketing campaign effectiveness;
- Total sales by batch, ticket type, country, and more.
In the end, you can turn data into smart decisions for your event with very little effort.