With more technology available, research shows event marketing has been growing 9% every year. After all, teams are now measuring what works and proving real results.
With the right metrics, you can plan better, attract more attendees, and convincingly justify investment to sponsors.
That’s why more and more events are being evaluated by data and metrics-based decisions, not just intuition.
But do you know what to measure? This event metrics glossary brings together the key indicators and teaches you how to use them.
Metrics or KPIs: what’s the difference?
First, if you’re measuring an event’s results, you need to understand the difference between metrics and a very famous acronym: KPIs (Key Performance Indicators).
Despite the technical-sounding name, it’s actually quite simple to understand each one!
- Metrics for events are the raw numbers that show what happened. For example: total registrants, attendees present, leads generated, promotional reach…
- KPIs, on the other hand, are strategic metrics, chosen based on a clear objective, that indicate whether the event is heading toward the desired success.
For example, if you’re running a low-budget event to capture leads, the number of leads captured is a metric.
In other words, a raw number representing your gain.
But the cost per qualified lead would be a KPI, because it shows whether the event achieved the goal of winning leads while spending little — or not.
Another example: the total number of registrations is a metric, but the percentage of the registration goal reached is a KPI.
You’ve probably noticed KPIs are built from metrics, right? So, how do you choose the right metrics to track?
Check out the metrics glossary below and identify what’s most aligned with your event’s goal:
Event metrics glossary
1. Show-up rate (or check-in rate)
What it is
Show-up rate, or check-in rate, is one of the first metrics collected on event day.
As the name suggests, it shows the percentage of registered people who actually attended the event and completed check-in.
How to calculate it
Show-up rate (%) = checked-in attendees divided by registrants, times 100
What it’s for
- Assessing the quality of registrations;
- Understanding whether pre-event communication was effective;
- Identifying audience interest and engagement with the event.
In practice, organizers often use this metric to gauge audience interest in what the event has to offer, as well as to provide sponsors with data on the number of people present at the event, for example.
Show-up rates also help fine-tune strategies like reminder emails, attendance confirmations, free vs. paid registration policies, and capacity control.
2. Social media engagement
What it is
As the name suggests, social media engagement measures the level of audience interaction with event content on social media, such as likes, comments, shares, mentions, and hashtag usage.
How to calculate it
Engagement rate = (interactions divided by reach or followers), times 100
Data such as hashtag mentions and follower growth can also be analyzed.
What it’s for
- Assessing the reach and impact of event promotion;
- Measuring audience interest and involvement;
- Understanding which content generates the most attention.
In practice, these metrics are used before, during, and after the event to create and optimize marketing campaigns.
As such, they serve the purpose of measuring promotional efforts, identifying which post formats attract more registrants, and which messages engage the audience most.
But be careful not to try to measure everything! Social media metrics can sometimes be vanity metrics.
So remember to collect data aligned with the event’s KPIs.
3. Lead generation
What it is
At events, a lead is any person or company that showed interest and shared contact details with consent for future engagement.
For example: an attendee who registered for the event; someone who filled out a form to learn more about the event; a booth visitor…
In other words, a lead is
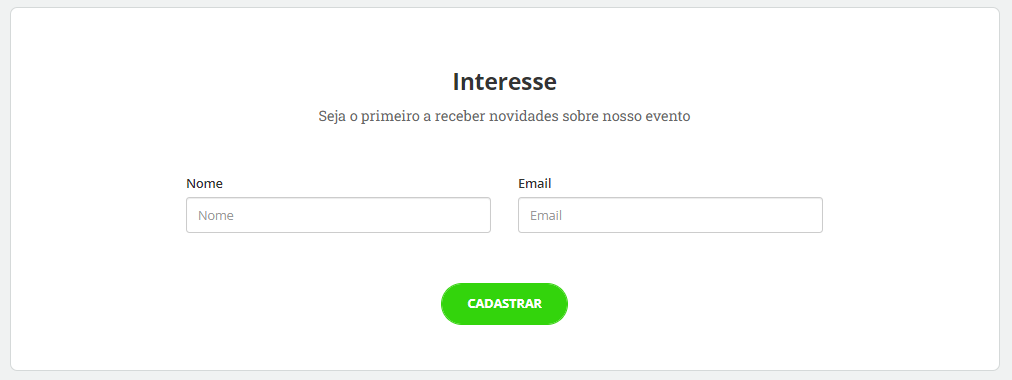
a person who showed interest in an event, product, or service and can receive communications until they actually become a customer.
How to calculate it
There are several ways to calculate the number of leads generated, depending on your goal and how you plan to capture them, such as:
- Number of people who filled out the registration form;
- Interest forms filled out;
- Material downloads (e-books, certificates, presentations);
- Booth visitors who left their contact information on-site.
You can also calculate the qualified lead rate as follows:
Qualified lead rate = total leads captured divided by leads that made a purchase or closed a deal, times 100
What it’s for
- Assessing the impact of the event on a marketing or sales campaign;
- Measuring the event’s value beyond direct revenue;
- Justifying investment in corporate events, trade shows, and conferences;
- Tracking opportunities generated by the event.
Lead generation is generally very common in B2B, institutional, and educational events.
In these cases, the event often serves as an initial point of contact to build a relationship with the audience, with the goal of eventually closing deals.
4. NPS (Net Promoter Score)
What it is
You’ve probably seen that kind of survey that asks, “On a scale of 0 to 10, how likely are you to recommend this to a friend or family member?” That’s the Net Promoter Score, or NPS.
It measures satisfaction levels and how likely attendees are to recommend the event to others.
How to calculate it
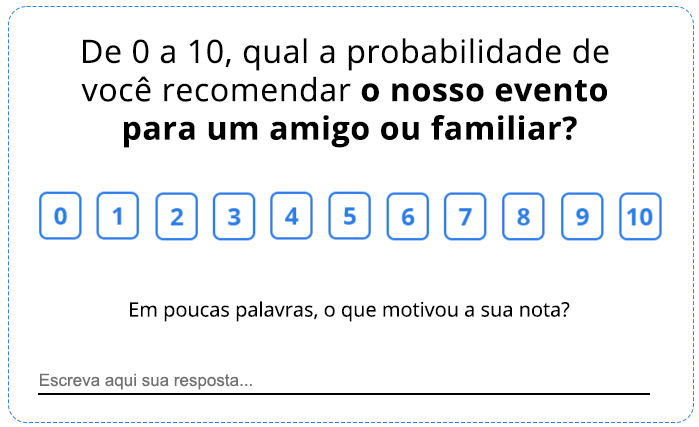 Based on the question: “On a scale of 0 to 10, how likely are you to recommend this event?”
NPS = percentage of promoters (9–10) minus percentage of detractors (0–6)
The Net Promoter Score classification range can go from -100 to 100 points, meaning:
- -100 to 0: Critical situation, full alert.
- 1 to 50: There’s a lot of room for improvement at your event.
- 51 to 75: Your event has quality — keep improving.
- 76 to 100: Your event is in the excellence zone, congratulations!
What it’s for
- Assessing the overall event experience;
- Identifying promoters and detractors;
- Comparing different editions of the same event;
- Analyzing audience reception of different activities;
- Enabling quick, simple analysis;
- Spotting shortcomings and driving improvements.
NPS is generally used in post-event surveys to understand perceived value, content quality, organization, and overall experience.
5. Cost per attendee
What it is
Shows how much was invested, on average, for each person who attended the event.
How to calculate it
Cost per attendee = total event cost divided by number of attendees
What it’s for
- Assessing financial efficiency;
- Comparing events, formats, or editions;
- Identifying opportunities to reduce costs;
- Setting the ideal ticket price for the event.
6. Attendee retention rate
What it is
Indicates the percentage of attendees who come back for future editions of the event.
How to calculate it
Retention rate = returning attendees divided by total attendees, times 100
What it’s for
- Measuring audience loyalty
- Assessing the consistency of the experience delivered
- Building communities around the event
7. ROI (Return on Investment)
What it is
Measures the return generated by the event relative to the amount invested. It can be measured for different things, such as revenue, leads, sales, or other defined objectives.
How to calculate it
ROI = (return obtained minus total investment) divided by total investment, times 100
What it’s for
- Assessing gains and losses from the event;
- Justifying the event to sponsors and managers;
- Comparing cost-benefit across events;
- Supporting future strategic decisions.
In practice, ROI can be financial or strategic, depending on the event’s objective (sales, lead generation, branding).
8. Website analytics
What it is
A set of data about the behavior of visitors on the event website, such as visits, most-viewed pages, traffic sources, and conversion rate.
How to calculate it
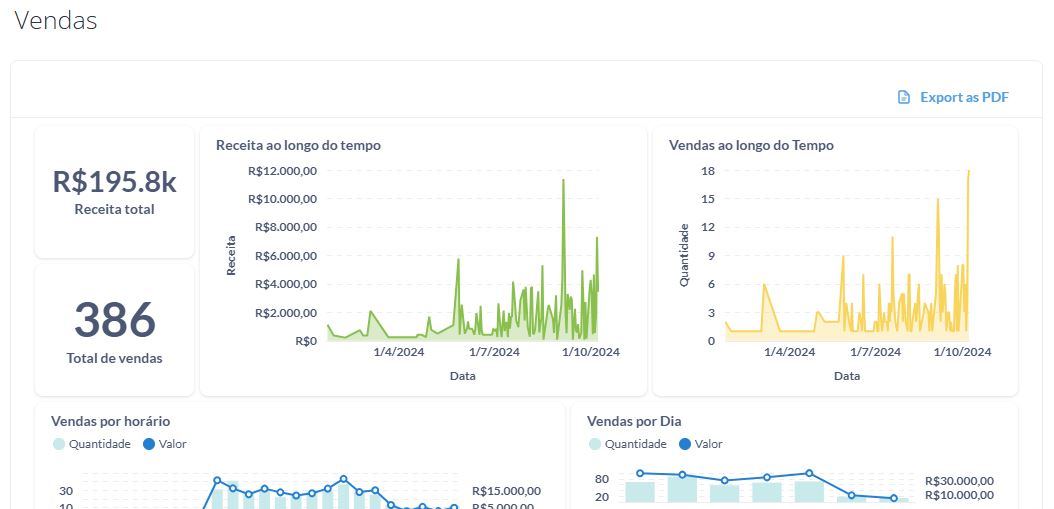 To get website analytics data, you need to use tools like Google Analytics or event platforms with this feature built in, like Even3 Analytics.
Common indicators include:
- Number of visitors
- Conversion rate (registrations divided by visitors)
- Traffic source (social media, email, ads)
What it’s for
- Understanding how people find the event;
- Building an audience profile;
- Identifying the pages that convert best into registrations;
- Optimizing promotion and user experience.
Overall, tools like Google Analytics offer different insights into your event’s audience.
But there are more robust tools that can give you a complete dashboard with charts on your event website’s visits and also on sales — that’s the case with Even3 Analytics, the platform’s native tool.
With Even3, you get everything in one place:
- Your event website’s data;
- Sales data;
- Attendee information;
- Custom reports from various event modules, like check-in and publications;
- Event feedback and much more.
With the help of an event platform, you can centralize data, analyze results, and learn from every edition. Want to give it a try?