Collecting data is one of the most important steps for anyone who wants to organize more efficient events and make strategic decisions.
However, many organizers end up using several different tools to gather this information: external forms, spreadsheets, apps, and marketing tools. All of that can make analysis harder and lead to the loss of important data.
The good news is that Even3 brings together several features that let you collect, centralize, and analyze your event’s data in one place.
In this guide, you’ll learn how to collect data on Even3 and which platform tools help turn information into strategic decisions.
Types of data organizers need to track
Before understanding how to collect data on Even3, it’s important to know which information actually makes a difference in event management.
Among the main types of data organizers should track are:
- Attendee registration data (name, email, institution, area of activity, etc.)
- Registration source and promotion channels
- Number of sales or registrations completed
- Attendance rate (show-up rate)
- Audience engagement during the event
- Leads generated for networking or business opportunities
- Financial results of the event
- Interactions with communications and promotional campaigns
Of course, the data you choose to collect will depend on your event’s goal and may go beyond this list.
That’s why you don’t need to monitor everything at once. On top of that, you can rely on Even3 to centralize information and simplify the evaluation of your event’s results, optimize promotion strategies, and improve the attendee experience.
How to collect data on Even3
Even3 has several tools that help organizers collect information throughout every stage of the event, from registration to the post-event phase.
So, here’s how each of them works.
1. Registration form
The registration form is how you collect data from participants in an event or activity.
Whether it’s for a workshop, a talk, a street race, or a scientific conference, the registration form is always the official way to declare genuine interest in the event.
But it’s important that it’s quick and easy to fill out. That’s because long forms tend to create more work to complete, and many participants end up giving up on them.
That’s why registration forms are the basic means of data collection. In them, it’s common to collect simple information such as:
- Full name
- Phone number
- Institution or company
- Position or area of activity
- City and state
On Even3, this data is stored on the platform and can be accessed and exported in the event’s People menu.
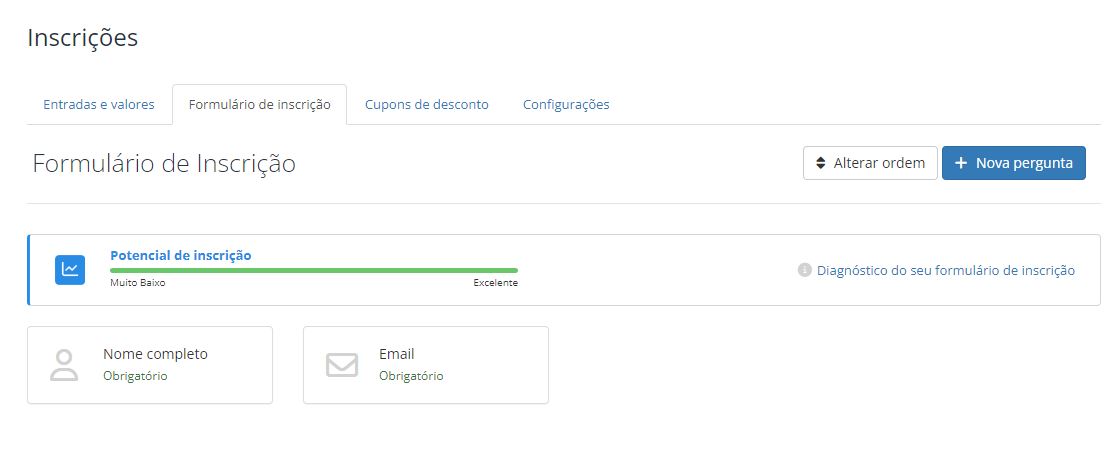
Practical example: Imagine you’re organizing an academic conference. When registering, participants provide their institution, research area, and city. With this data, you can understand where your audience comes from and which areas have the most interest in the event.
2. Custom forms
Besides the standard registration form, Even3 lets you create custom forms to collect additional information from your audience, such as:
- Audience research
- Activity preferences
- Reviews and evaluations
- Event vendor data, etc.
The forms can include different types of questions, custom fields, and even visual elements aligned with the event’s identity.
Basically, it’s like Google Forms, but free within Even3. This keeps all responses recorded on the platform, making data analysis easier.
Practical example: After registering for an event, the organizer can send an additional audience research form to build their brand’s persona, understand audience preferences, and make improvements to the event.
3. Check-in app
During the event, the check-in app is responsible for registering attendee presence.
However, besides speeding up check-in, it also generates important data about attendance and event logistics.
For example, when scanning a participant’s QR code, the app automatically registers their attendance confirmation.
It can also be used to record other information, such as kit or material handouts.
This data lets you calculate important metrics, such as the real attendance rate (show-up rate).
This tool is used through Even3’s check-in app, connected to the event dashboard.
Practical example: After the event, the organizer can analyze how many registered attendees actually showed up. If the event had 500 registrations but only 350 check-ins, it’s possible to calculate the attendance rate and consider strategies to boost attendance in future editions.
4. Even3 Analytics
Even3 Analytics is the platform’s data analysis dashboard. Basically, it brings together important metrics about the event’s sales and the behavior of visitors to the event page.
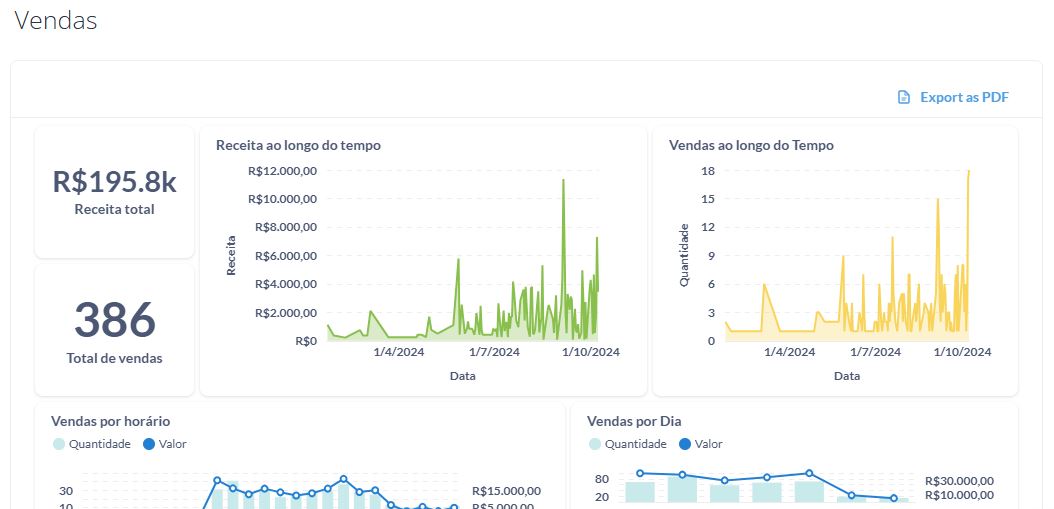
With it, the organizer can track data such as:
- Number of visitors to the event website
- Demographic data of event website visitors
- Main ways visitors access the event website
- Traffic source
- Volume of registrations over time
- Sales peaks
- Most used payment methods
- Country of origin of payments
This information is available in the Analytics menu inside the event dashboard and is displayed in charts that make it easier to visualize trends.
This data helps you understand, for example, which promotion strategies are working best and which channels are generating the most registrations.
Practical example: By looking at sales charts, an organizer notices that registrations always increase after sending promotional emails. With this, they can reinforce this strategy in future campaigns.
5. Lead collector
At in-person events, especially trade shows and exhibitions, many interactions happen quickly between visitors and exhibitors.
In this context, Even3’s lead collector helps turn these conversations into organized contacts.
In practice, it’s an app that lets you scan participants’ QR codes and quickly record their contact details.
This way, important information is automatically recorded in the app and in the exhibitor area on Even3, so nothing gets lost after the event.
Practical example: During a trade show, an exhibitor talks with several participants interested in their products. By scanning their QR codes, they automatically save the contacts and add information about them to follow up after the event.
6. Custom reports
For organizers who need more detailed analysis, Even3 also offers custom reports.
In short, these reports let you organize and visualize specific event data, such as:
- Attendee lists
- Sales performance
- Certificates issued
- Activities held
In practice, they can be extracted according to the organizing institution’s or company’s needs and are accessed within Even3’s reports menu.
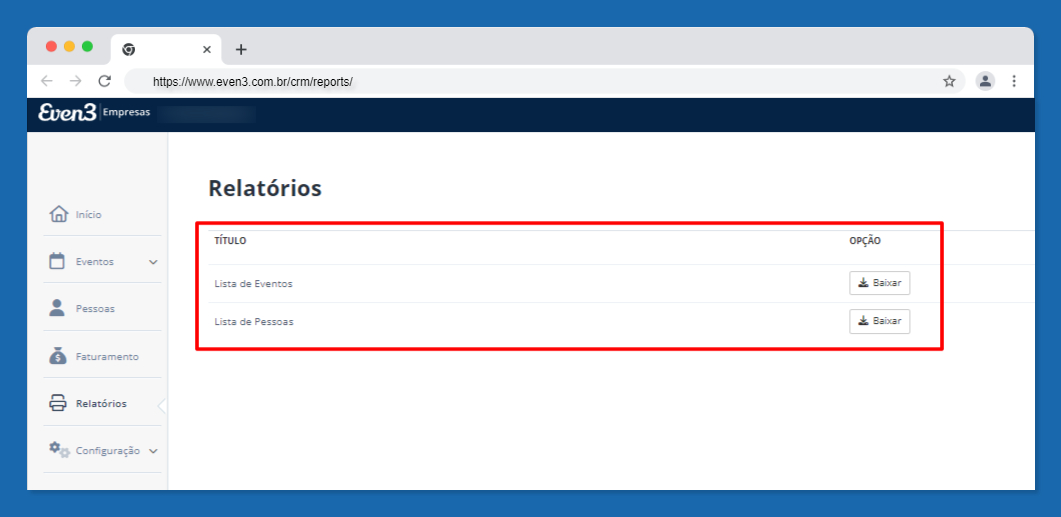
This way, customization lets teams analyze information more strategically, making it easier to track results and make decisions.
Practical example: An institution that organizes several events throughout the year can generate event reports to compare which events have more attendees, sales volume, and, consequently, deliver the best results.
7. Integrations
Even3 also lets you connect your event to other tools through integrations with external platforms.
These integrations make it easier to automatically share data with marketing, CRM, ads, or financial management systems.
In practice, information collected at the event automatically feeds other systems used by the team, making data collection faster, safer, and more connected.
Practical example: By integrating Even3 with a marketing automation tool, such as RD Station, registered attendees’ data can be automatically sent to relationship campaigns. This lets the team continue communicating with participants after the event.
8. Satisfaction survey
Finally, your event is over, and now it’s time to collect the last data through the attendee satisfaction survey.
This feature lets you create evaluation forms to understand how the audience perceived the event, which aspects were most positive, and what can be improved in future editions.
On Even3, evaluations can be set up within the Event Evaluation menu, letting you collect information such as the event’s overall rating, evaluation of talks, organization, infrastructure, and improvement suggestions.
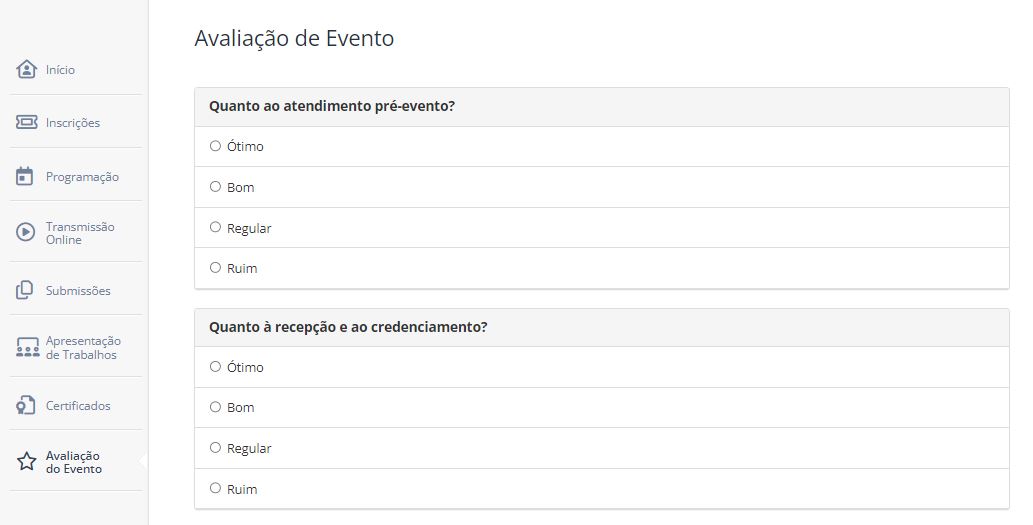
The organizer can also link the completion of the evaluation to the issuing of the certificate, which tends to significantly increase the response rate.
Practical example: By analyzing survey results, the organizer notices that the talks’ content received very positive ratings, while the venue’s infrastructure received lower scores. With this insight, they can keep the program format and look for logistical improvements for the next edition of the event.
How to turn this data into decisions for your event
Collecting data is only the first step. After all, the real value lies in analyzing this information and using it to make more strategic decisions about your event.
By tracking registration, attendance, engagement, and satisfaction data, you can identify important patterns, such as which channels bring more attendees, which activities generate the most interest, and which points of the experience need to be improved.
These insights help the organizer make more confident decisions, such as:
- adjusting promotion strategies
- improving event logistics
- optimizing the schedule
- better understanding the audience profile
- planning future editions more efficiently
With Even3, all of this data is centralized and accessible within the platform itself. This makes analysis easier and lets you track your event’s progress in real time.
So, if you want to organize more strategic, data-driven events with a greater chance of success, create your event on Even3.