Did you know that as soon as you create an event on Even3, you already have its data? Now it’s just a matter of looking at it!
Every registration generates information. Every visit to the event website, every ticket sold, and every approved payment leaves a trace.
The problem is that, in the rush of things, that trace usually ends up scattered. For example, part of it sits in a spreadsheet, another part in a financial report, and so on. But if you want a more integrated view of your data, all you have to do is open Even3 Analytics!
It brings your event’s data together in a single dashboard, right inside the platform. Have you used it yet?
In this article, I’ll explain how this Even3 tool works and how it can help you.
Why track your event’s data?
To start, it’s important to understand how and why to track an event’s data.
Actually, if you think data is only useful for a final report, you’re already using your event’s data the wrong way!
That’s because data is mainly useful for acting DURING the operation, while there’s still time to change course.
For example, when you track data closely:
- You stop guessing: instead of assuming who your audience is and when they buy the most, you confirm it through the dashboard;
- Your marketing campaigns get corrected in time: if sales drop after an ad or rise after an email, you notice it quickly;
- You plan batches based on real behavior: you know when your audience buys and adjust deadlines accordingly;
- Reporting closes faster: payment methods and totals are already organized in the dashboard;
- You use the experience from one event in the next: each edition becomes a reference for the following one.
On top of that, organized data makes conversations with whoever funds the event easier. Course coordination, a dean’s office, a sponsor, or a board of directors: everyone understands a number better than an impression.
What is Even3 Analytics?
Speaking of data, now it’s time to look at the tools we use to track it.
Even3 Analytics is Even3’s tool that centralizes your event’s data in a single dashboard.
Think of it as a Google Analytics built for events. The logic is similar, but the focus is different: instead of only looking at website traffic, Even3 Analytics also shows what’s happening with registrations, tickets, and payments.
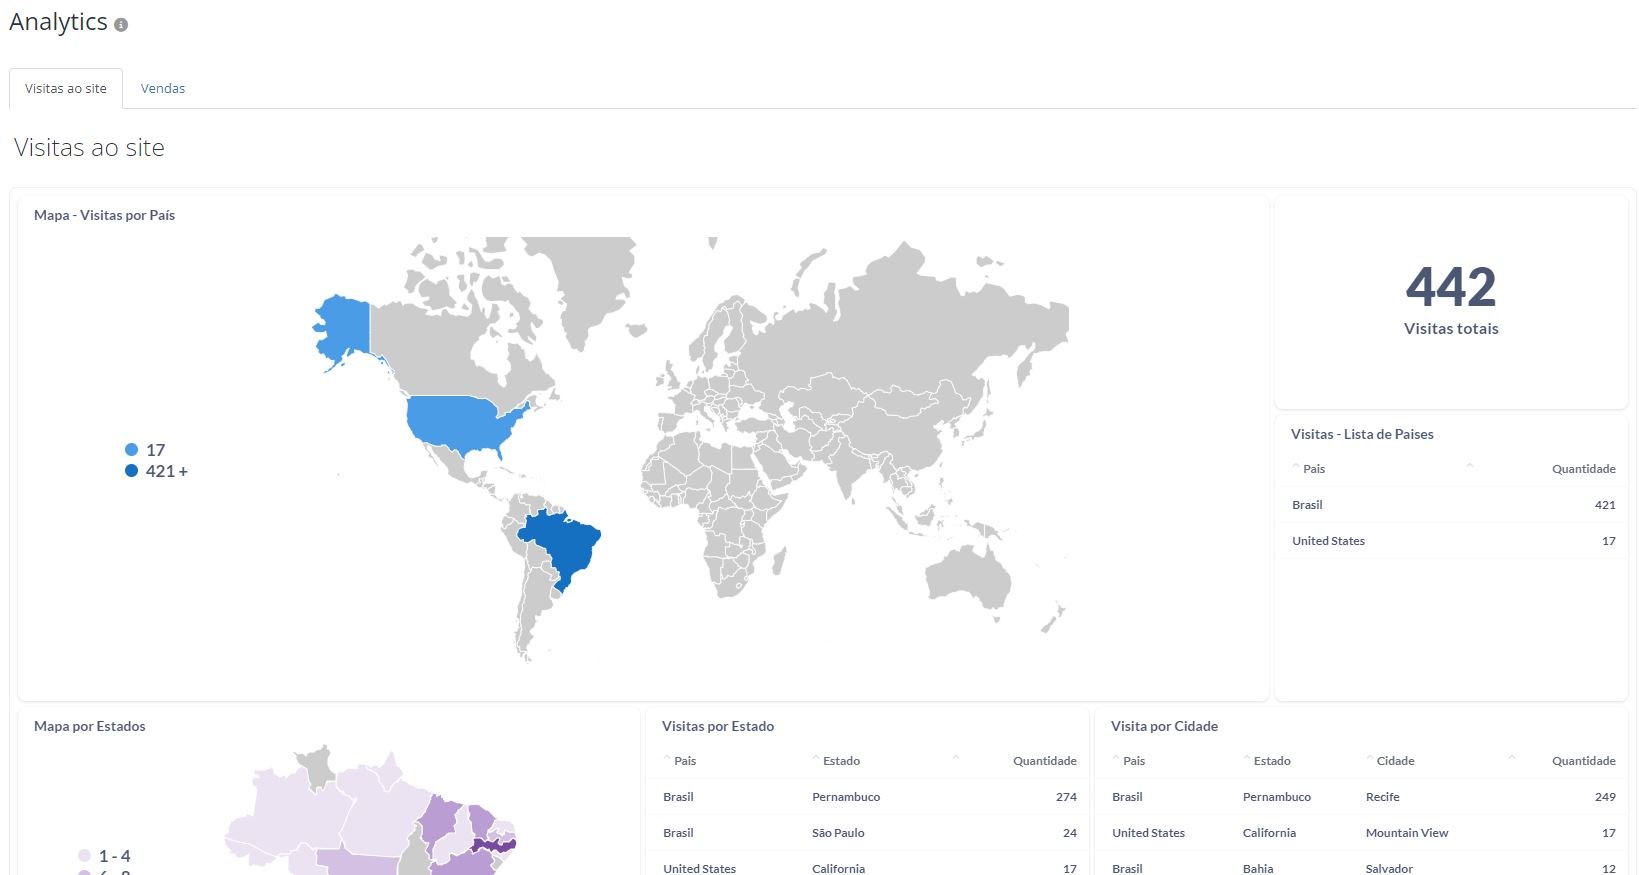
And since the dashboard is already built into the platform, you don’t need to install anything or set up tracking codes to get started.
What’s the difference between Even3 Analytics and Google Analytics?
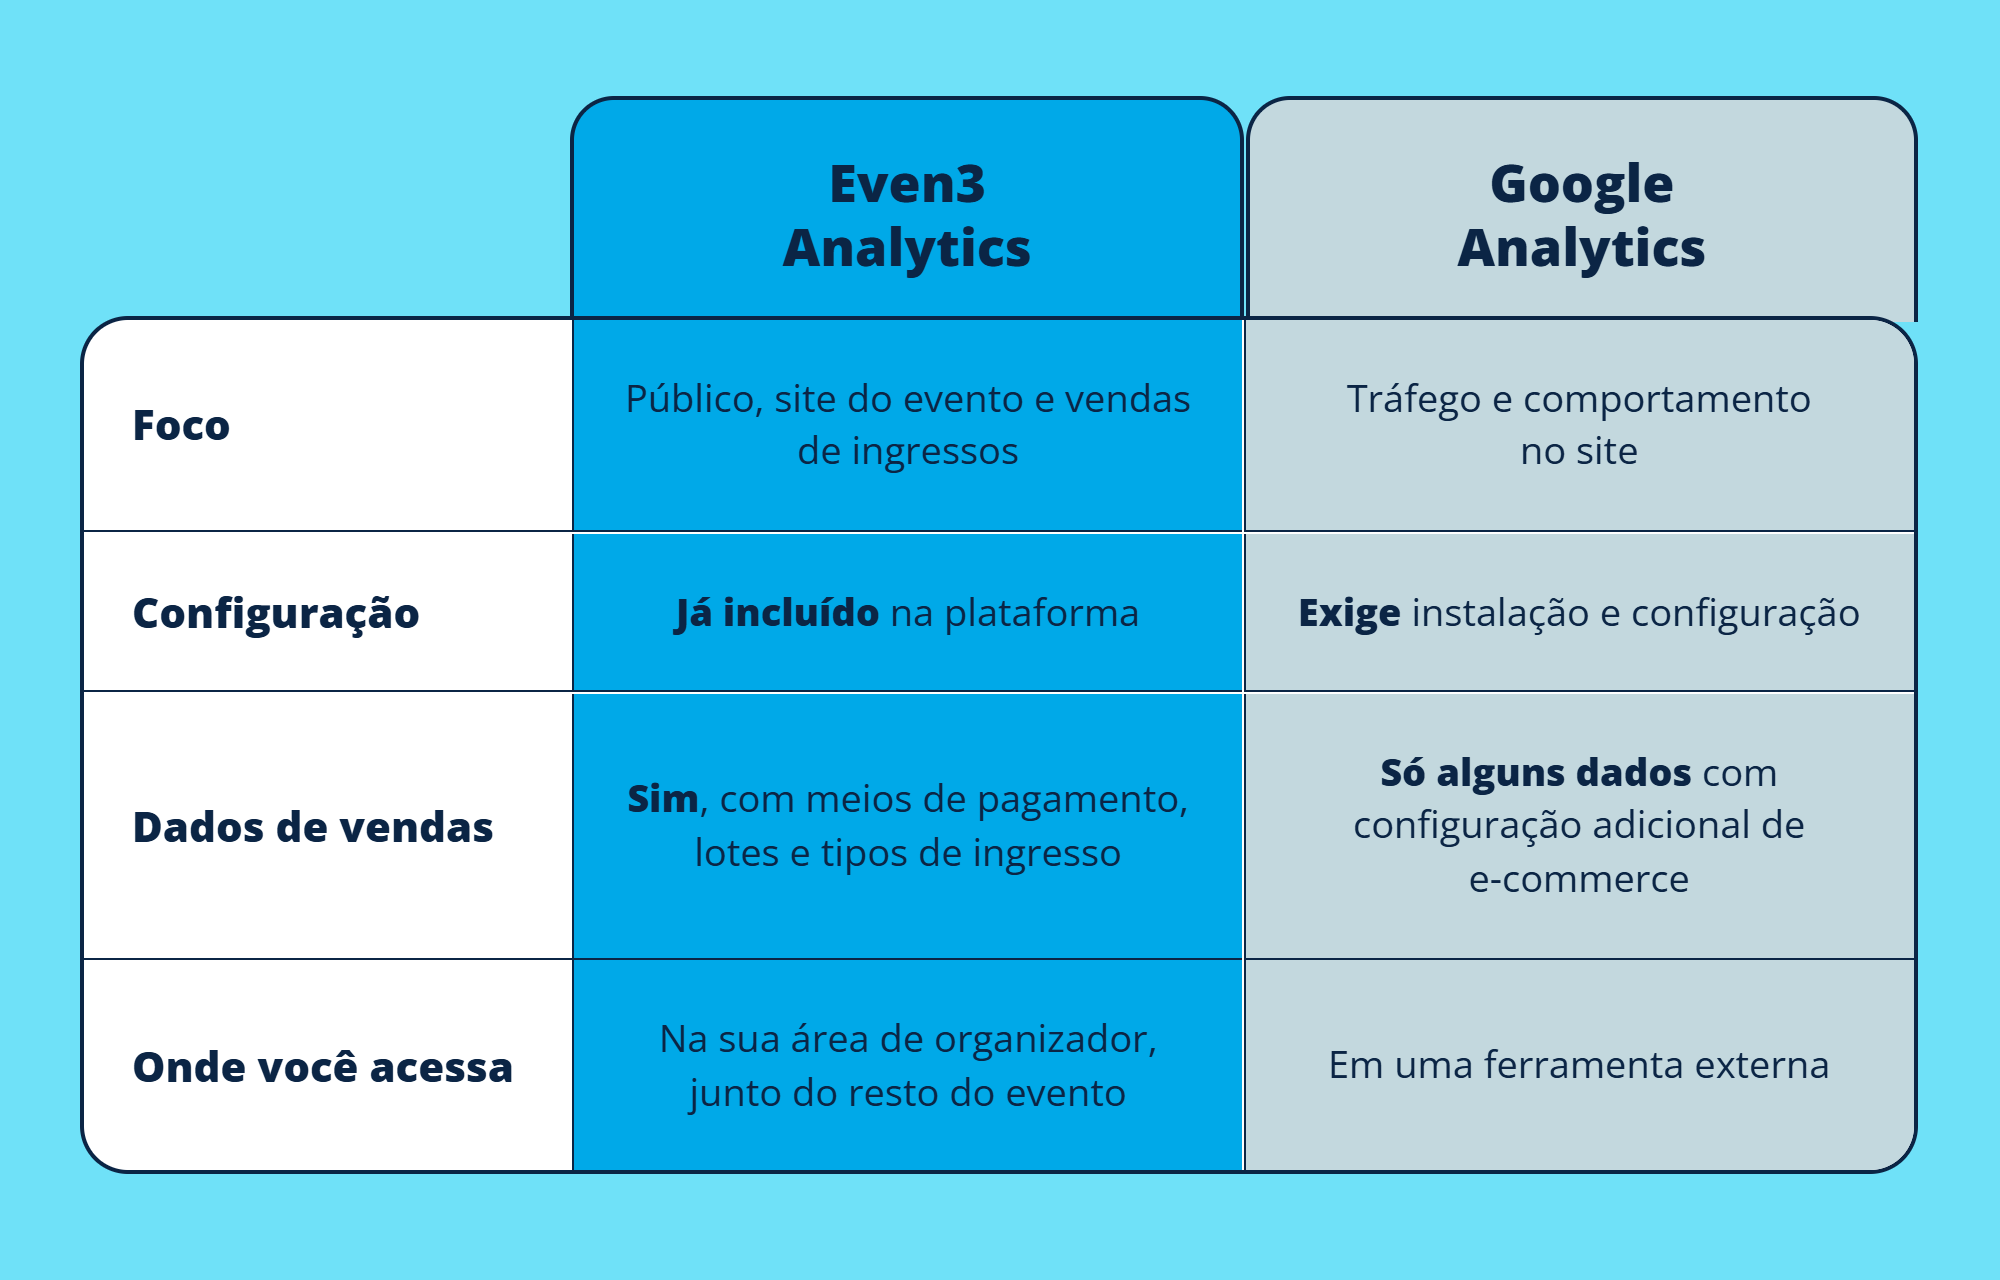
Despite the differences, the two tools complement each other. But Google Analytics can be harder to use. Even3 Analytics, on the other hand, makes life easier for organizers of any kind of event, at any level of expertise.
What data can you find in Even3 Analytics?
1. Demographic data: get to know who attends your event
What it is: the profile of whoever visited your event’s page.
How you use it: adjust the schedule, communication, and partnerships to match your real audience.
Knowing who registered for your event changes concrete decisions.
For example, a Brazilian scientific congress notices its event website got a lot of traffic from other Latin American countries. So it enables automatic translation of the website to attract foreign attendees.
2. Website visitors: turn interest into registration
What it is: the behavior of whoever visited the event website.
How you use it: insights for marketing and ad campaigns, plus tracking results.
Lots of people visit the event page and don’t complete registration the first time. That’s normal.
But looking at the data will show you whether there’s a big gap between the number of visitors and completed registrations. That’s a sign you can improve!
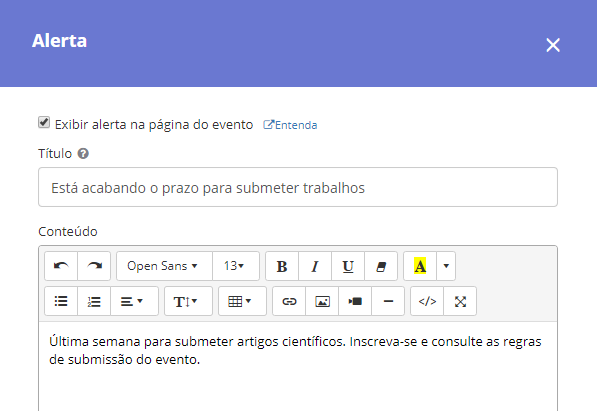
So, you can create marketing campaigns during the times of day with the most website visits, trigger alerts and coupons during those moments, invest in remarketing campaigns targeting people who visited your event’s site but didn’t register… In short, improve your event’s marketing campaigns!
3. Payment methods: build reports quickly
What it is: how your audience paid (card, instant payment, bank slip).
How you use it: put together your financial report and understand your cash flow.
Reporting tends to be the most tedious part of the operation, especially for institutional events, with defined deadlines and formats.
The dashboard shows which payment methods your audience used. This way, you build your financial report with consolidated data and understand the effect each payment method has on your cash flow.
4. Sales peaks: another data source for marketing
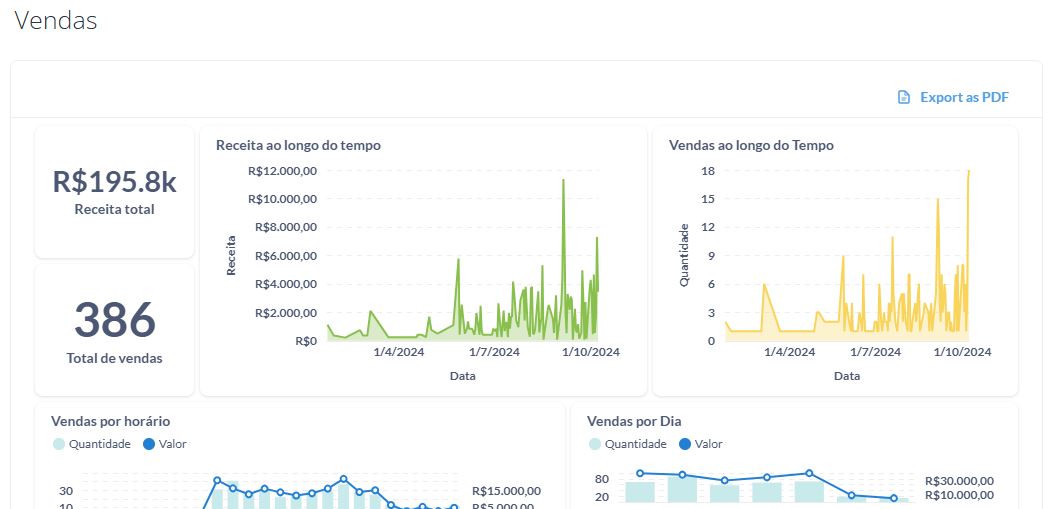
What it is: the days and times when sales peaked.
How you use it: measure how effective your campaigns were and choose the best time to promote.
This is another super useful data point for your marketing!
For example, say you sent an email on a Tuesday afternoon. Posted on social media on Thursday. Ran an ad over the weekend.
The dashboard shows which days and times sales were concentrated in. Then you compare that against your promotion calendar and see what worked.
After that, you just repeat what worked and adjust what didn’t convert.
5. Sales by batch, ticket type, and country: understand your revenue
What it is: total sales by batch, ticket type, and country.
How you use it: set prices, batch deadlines, and reach strategy.
Besides helping you build a solid financial report, here you also see where the event’s money is coming from.
- How many registrations did each batch generate?
- Which ticket type sold the most?
- Which countries did registrants come from?
With these answers, you can better set the price of the next batch, decide whether it’s worth creating a new ticket category, and assess whether the event has enough international reach to justify promoting it abroad.
How to use Even3 Analytics in your event’s routine?
Having the dashboard is the first step. But using it well is what generates results. So, follow this sequence:
1. Define what you want to find out before opening the dashboard
Start with a simple question: “Are registrations on the expected pace?” or “Did last week’s campaign work?” A clear question keeps you from getting lost among the numbers.
2. Set a check-in routine
Checking once a week works well during the promotion phase. But once the event gets close, it’s worth checking daily, since that’s when registrations pile up.
3. Cross-reference the data with your promotion calendar
Note the dates of your marketing actions in one place. Then compare them with the sales peaks in the dashboard. The relationship between the two pieces of information shows what actually drove registrations.
4. Create a trackable link for each promotion channel
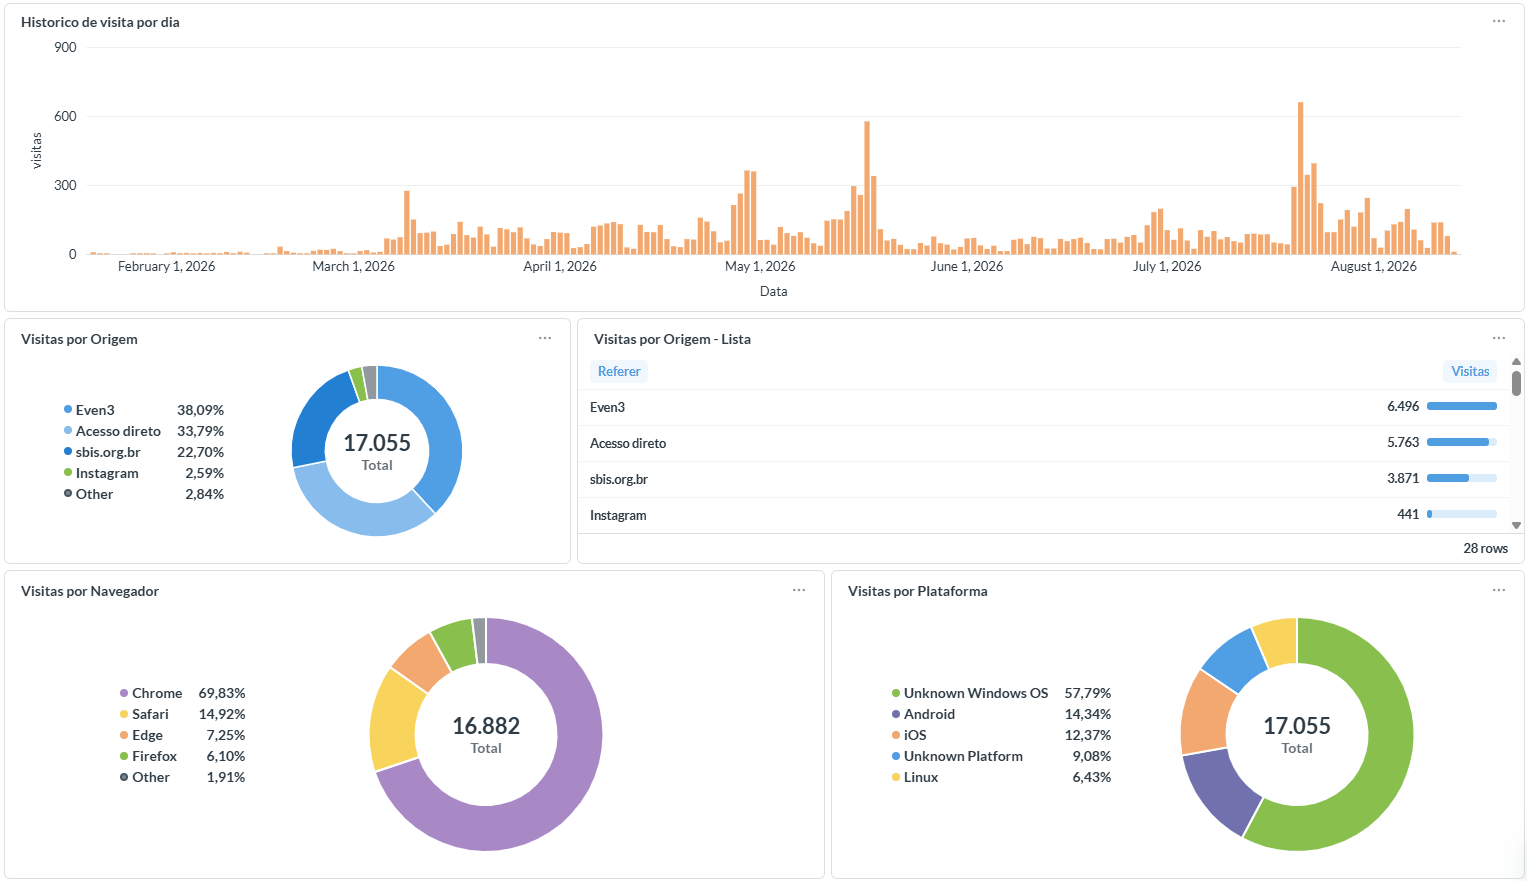
Besides sales peaks, Even3 Analytics also shows where your website visitors came from.
So, if you want to know whether they came from your marketing campaigns or your social media, you can create trackable links, also known as UTMs.
The idea is simple: each channel gets a different link. This way, the dashboard shows separately who arrived via Instagram, email, or a WhatsApp group.
And you don’t need to build the link by hand. Google’s Campaign URL Builder does it for you. Just fill in a few fields:
- Website URL: your event’s website link.
- Campaign source: where the visit came from, such as instagram or newsletter.
- Campaign medium: the type of channel, such as social, email, or qrcode.
- Name: create a name to further specify tracking within the same social network. For example, use “campaignJul” and “campaignAug” to tell apart marketing campaigns run in different months, both on Instagram.
A tip: always write in lowercase letters, without accents and without spaces. For tracking purposes, “Instagram” and “instagram” count as different sources.
Finally, the tool generates the ready-made link, and you just copy it. After that, save each link in a spreadsheet, with the date and the corresponding channel, and promote that link instead of the original one.
This way, you’ll be able to see those channels in the Traffic Source data in Even3 Analytics and track information about them.
5. Cross-reference the dashboard data with your social media insights
Even3 Analytics shows the profile of whoever registered. Instagram, LinkedIn, and Facebook show the profile of whoever follows your event on social media. When you put the two pieces of information together, the picture of your audience becomes much more complete.
Compare, for example:
- Age and location. Do your Instagram followers match the profile of who actually registers? If not, you might be talking to one audience and selling to another.
- Peak activity times. Social media shows when your audience is online. The dashboard shows when sales happen. If the two times line up, you already know the best time to post.
- Content with the most engagement. See which posts had the most reach and cross-reference that with the visit peaks on the event website. The topic that engages the most tends to be the best promotional argument.
With this cross-reference, you build a more detailed audience profile. And in the next edition, you start promotion already knowing who to talk to, where to talk to them, and at what time.
6. Keep the numbers from each edition
At the end of the event, record the main results. If you’d like, create a visual presentation.
This way, in the next edition, you start with a baseline for comparison instead of a blank page.
7. Share it with your team and partners
Finally, data that stays only with you doesn’t lead to a collective decision.
So, bring the numbers and the data presentation to team meetings and to conversations with sponsors.
Organizing an event involves many small decisions every day. Opening a new batch, changing when a message goes out, investing more in ads… Each of these gets easier when you have a number in hand.
Now, it’s time to organize your event with data!
Even3 Analytics centralizes your data in a single dashboard, without ever leaving Even3. But that’s just one more of the platform’s centralized features! Want to know more?
Use Even3 for free to build registration forms, check in attendees, automatically generate certificates, and much more.