Have you ever thought about doing an annual review to identify the gains and losses in your company’s events?
The end of the year is the ideal time to reflect on achievements, identify opportunities for improvement, and plan your next steps.
With the right reports, you can reach these conclusions and share valuable data with your team.
This includes information about your attendees, your financial dashboard, Google Analytics, the activities carried out throughout the year, and much more.
Here’s what you’ll learn:
- Why are reports important?
- Types of reports for your annual event review
- How to create custom reports with Even3
Why are reports important for your annual review?
Reports work like a mirror of your events’ performance, providing valuable data that helps you:
- Understand your audience: Who are your attendees, what audience did you reach throughout the year, and how can you keep reaching them?
- Evaluate financial return: What was the total revenue from the events held? Which activities had the biggest impact on sales?
- Identify trends: What types of events generated the most engagement and participation?
- Guide future decisions: Concrete data helps define strategies for the next year, avoiding mistakes and repeating successes.
This data is usually presented to leadership and teams to demonstrate the value of events within the company’s business plan.
Beyond that, this detailed information helps generate insights to improve the organization of upcoming events.
Types of reports for your annual event review
Now that you know what reports are for, check out some examples you can collect from event platforms like Even3.
1. Sales report
This is one of the most sought-after reports by companies. After all, it’s essential to track the total amount raised from the activities offered by the company that year.
This type of report should break down the balance of each type of event held individually, as well as the sum of the balances of all events.
To get it, you need a tool that has collected and stored your events’ sales data.
After all, you can’t keep track of everything manually, right? A lot of information can get lost!
Today, some event platforms already compile this data for you.
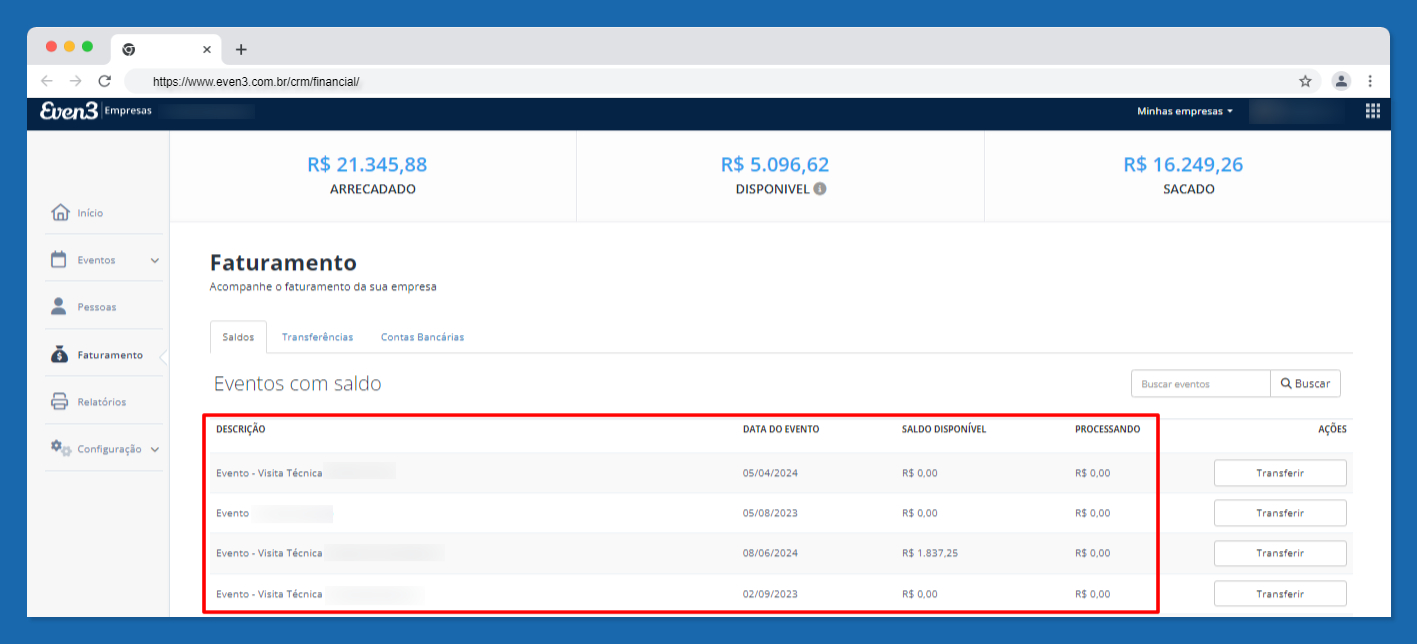
For example, the Even3 Enterprise plan offers a Billing menu.
There, you can track data such as a summary of event revenue, total value of inflows and outflows, transfers made, and bank accounts registered for events.
2. Attendee report
Another widely used report in Even3 Enterprise is the events’ people report.
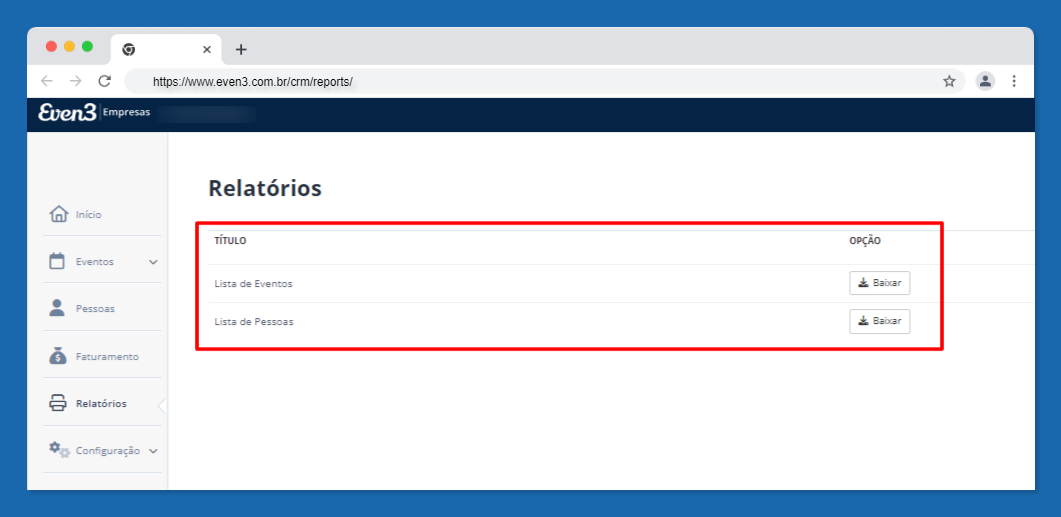
With it, you can access data about registered attendees, such as name, email, phone, event, and registration category.
This type of report can help you:
- Understand your audience profile based on registration category;
- View the events with the highest number of registrants;
- Export contact data to an email marketing tool and work on post-event communication.
3. Google Analytics
Speaking of your audience profile, another tool that can help is Google Analytics.
It uses site visit data to generate metrics such as location, devices used, average time on site, pages visited, and more.
All of this can give you a more detailed profile of your attendees and their behavior online.
At the end of the year, this data can be presented to your team to build your audience profile.
Afterward, you can create more targeted marketing campaigns to reach people in that same group.
Some event platforms, however, can offer you more robust data.
For example, Even3 has its own Analytics tool. There, you’ll see your site’s access data in a simplified way compared to Google.
Plus, there’s also information about your attendees’ profile and sales data throughout the event, such as sales peaks, drops, most used payment methods, and much more.
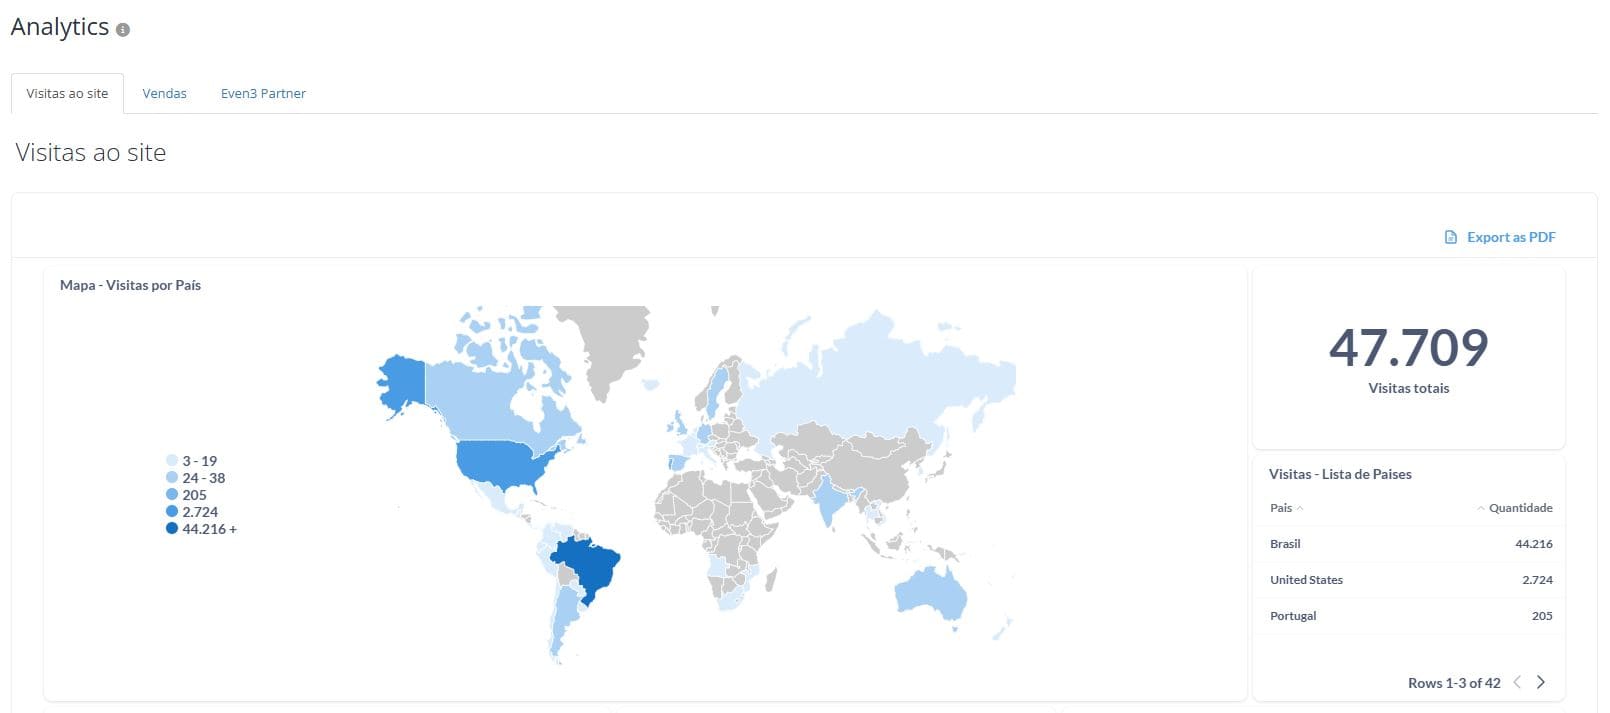
This way, the most important information about your audience and their behavior stays centralized in one place, making it easier to manage your event.
4. Activity report
As the name suggests, an activity report gives you an overview of the activities created within an event’s schedule.
In it, besides the activity type and name, you’ll find information such as:
- Date;
- Start and end time;
- Registration;
- Number of registrants.
This way, you can identify which activities were held the most during the year, such as talks, workshops, and others.
5. Certificate report
Finally, how do you measure the impact of the events your company organizes? Start by counting how many people now hold certificates!
Much of your audience will use them to prove acquired knowledge, count continuing education hours, and boost their professional careers.
The number of certificates you issued throughout the year is extremely relevant!
With a detailed report of the events your company created, you can find the number of certificates issued per event and the total sum of them all.
You can also access data such as the number of checked-in attendees, the date certificates were sent, and much more.
For this, using an event platform like Even3 is essential, since it handles the collection, storage, and organization of this data for companies.
How to create reports with Even3 Enterprise
Some tools make it easier to create reports for your company’s annual event review. That’s the case with Even3 Enterprise.
Even3’s enterprise product is designed for people who organize more than one event a year, offering special features such as:
- Report creation: Create reports for your annual review;
- Metric customization: Build spreadsheets with more detailed metrics for your events, such as categories, format, registration types, and more;
- Event portal: Organize and centralize all your events on a single site accessible to your attendees;
- Event websites: Edit and customize websites for each of your events using your own brand;
- Centralized information: Access all your event data from a single dashboard;
- VIP support: Take advantage of training and consulting sessions with Even3 specialists.
To start creating your reports, simply use the Even3 Enterprise plan and access the reports menu on the platform.